Accounts receivable aging analysis sorts unpaid invoices into time bands, typically 0 to 30, 31 to 60, 61 to 90, and 91-plus days past due, so you can see exactly where your cash is stuck and who owes it. The payoff is twofold: you know which accounts to chase first, and you get a defensible basis for estimating bad debt under ASC Topic 326.
A 2022 review of 250,000 invoices found 63% were paid within 30 days, which means well over a third land in your aging buckets and demand active management.
This guide walks through building, reading, and acting on an aging report, from reserve calculations and cash forecasting to the point where an overdue account is better handled by outside professionals.
TL;DR
- Only 63% of invoices are paid within 30 days, so more than a third of your receivables need active tracking in aging buckets.
- Bucket invoices by due date, not invoice date, and include unapplied cash and credit memos, or your past-due totals will be inflated.
- Match bucket ranges to your real credit terms: a net-60 freight portfolio judged against 30-day buckets will look late when it isn’t.
- One clean aging report should drive three decisions: who to call this week, how much to reserve under ASC 326, and how much cash to forecast.
- Accounts past 90 days with no payment plan or with broken promises are ready for outside help, and Retrievables matches them with collection attorneys and agencies at no upfront cost.
What an Accounts Receivable Aging Report Looks Like
An aging report for accounts receivable is a snapshot, not a running ledger. It captures every open invoice as of a specific date and slots each one into a time bucket based on how many days have passed since the due date, not the invoice date. That distinction trips up more finance teams than any other part of the process.
Most companies use five standard buckets: current (not yet due), 1 to 30 days past due, 31 to 60, 61 to 90, and 91-plus. Some industries stretch or compress these ranges. A construction subcontractor working on net-60 terms might use 0 to 60, 61 to 120, and 121-plus instead, because anything inside the contractual term isn’t really “late” yet.
You’ll typically build the report one of two ways:
- Invoice-level layout: every open invoice appears as its own row, with columns for invoice number, date, due date, amount, and bucket. This is the version your collections staff works from daily.
- Customer-level layout: invoices are rolled up by customer, showing total exposure per bucket. This is what you hand to a credit committee or a lender asking about receivable quality.
Whichever layout you choose, a usable report needs these fields at minimum: invoice date, due date, original amount, current balance, days past due, and customer name or account number. Two fields get skipped constantly and shouldn’t be: unapplied cash (payments received but not matched to an invoice) and credit memos. Leaving those out inflates your past-due totals and makes healthy customers look like risks. QuickBooks’ own guidance on the AR aging report notes that a large share of small businesses carry invoices more than 30 days overdue, which is exactly why the report needs to be clean before you act on it.

How to Create an AR Aging Report Step by Step
You can build an aging report in a spreadsheet in under an hour, or pull one directly from your accounting system in seconds. Both methods require the same underlying data: a full export of open invoices, including issue date, due date, terms, and current balance.
Here’s the reproducible process:
- Export open invoices. Pull every unpaid or partially paid invoice from your accounting or ERP system, along with any unapplied credits sitting on customer accounts.
- Calculate days past due. For each invoice, subtract the due date from today’s date. In a spreadsheet, this is simply
=TODAY()-[Due Date]. A negative result means the invoice isn’t due yet.
- Assign each invoice to a bucket. Use a nested
IF formula or VLOOKUP against a bucket table: 0 to 30, 31 to 60, 61 to 90, 91-plus. A lookup table saves you from writing four nested conditions by hand.
- Build a pivot table by customer. Summarize total exposure per customer per bucket. This turns a few hundred invoice rows into a one-page view of who owes what and how late it is.
- Reconcile the total to your general ledger. Your aging report’s grand total should match the AR balance on your balance sheet. If it doesn’t, you likely have unapplied cash or a timing mismatch to track down.
If you’re running QuickBooks, NetSuite, or a similar system, the report exists natively under standard financial reports; you just need to set the “as of” date and bucket intervals correctly. The advantage of the system-generated version is that it ties directly to the general ledger, so reconciliation errors are rarer.
Whichever method you use, validate before you trust the numbers. Unusually large unapplied cash balances, invoices with custom payment terms that got bucketed against standard terms, and disputed invoices still sitting at full value are the three most common sources of a misleading report.
Pro Tip: Run your aging report on the same day each week or month, and keep the “as of” date fixed relative to your billing cycle. Comparing a report pulled on the 5th one month to one pulled on the 28th the next will make your trends look worse or better than they actually are.
How to Analyze and Interpret an Aging Report
Reading an aging report is about triage, not just observation. The report tells you where the money is stuck; your job is deciding what to do about each pocket of it.
Start with a simple rule: work the largest dollar amounts in the oldest buckets first, but don’t ignore the current bucket entirely. A customer who consistently pays on day 32 instead of day 30 is a pattern worth flagging before it becomes a habit that costs you real cash flow.
Watch for these red flags as you review:
- Concentration risk. If one customer or one industry vertical accounts for a disproportionate share of your 61-plus bucket, a single default could hit you hard.
- Rising older buckets month over month. If your 91-plus total keeps growing relative to total AR, your credit terms or collections process has a structural problem, not just a few slow payers.
- Large unapplied cash balances. Payments sitting unmatched for more than 30 to 60 days often signal a process breakdown, or in rarer cases, misapplied or fraudulent activity, according to Stripe’s analysis of aging data.
- Repeat late payers with no dispute on file. If there’s no documented reason for the delay, it’s a collections issue, not a service issue.
For accounts drifting into 60 and 90-plus days, the decision tree usually looks like this: offer a short payment plan if the customer has a history of eventually paying, consider a modest early-payment discount if cash flow pressure is mutual, and escalate to outside collections once communication stops or promises repeatedly break. Reviewing effective strategies for chasing outstanding invoices before that point often prevents the escalation altogether.
AR Turnover and Days Sales Outstanding vs. Aging
Aging tells you where problems live today. Accounts receivable turnover analysis and days sales outstanding (DSO) tell you whether your collections process is getting better or worse over time. You need both.
The accounts receivable turnover ratio is Net Credit Sales divided by Average Accounts Receivable. Divide 365 by that turnover ratio and you get receivable turnover in days, a rough proxy for how long it takes, on average, to collect a sale.
| Metric |
Formula |
What it tells you |
| AR turnover ratio |
Net Credit Sales ÷ Average AR |
How many times you collect your full receivable balance per year |
| Days Sales Outstanding |
365 ÷ AR Turnover Ratio |
Average number of days to collect a sale |
| AR aging |
Invoice balance sorted by days past due |
Exactly which invoices and customers are overdue right now |
Say a company posts $2.4 million in annual credit sales with an average AR balance of $300,000. Turnover comes out to 8, meaning the company collects its full receivable balance roughly eight times a year, or a DSO of about 46 days. If your standard terms are net-30, a 46-day DSO tells you something is off, but it won’t tell you who. That’s where the aging report comes in.
Turnover and DSO should be read with context. A high turnover ratio can reflect tight credit terms rather than strong collections, while a low one may point to lenient terms as much as poor follow-up, a distinction OpenStax’s finance materials make explicit. Use aging weekly to manage individual accounts. Use turnover and DSO monthly or quarterly to judge whether your overall credit policy needs to change.
Allowance for Doubtful Accounts and Expected Credit Loss
Your aging report doesn’t just drive collections calls. It’s also the primary input for estimating how much of your receivable balance you’ll never collect.
The most common method is percent-of-bucket: apply a historical loss rate to each aging bucket (say, 1% for current, 5% for 31 to 60 days, 20% for 61 to 90, 50% for 91-plus) and sum the results to get your allowance. Companies then adjust those baseline percentages for known factors, like a customer’s bankruptcy filing or a shift in economic conditions.
ASC Topic 326 formalizes this under the current expected credit loss model. It requires you to weigh three inputs together: historical loss experience, current conditions, and reasonable and supportable forecasts, then revert to historical loss data once you’re beyond the period you can reasonably forecast. That reversion requirement catches a lot of preparers off guard; you can’t just extend an optimistic forecast indefinitely.
Documentation matters as much as the math. Keep a record of:
- The historical loss rates you used and the period they cover
- What current conditions (industry stress, customer-specific news) adjusted those rates
- Your forecast horizon and the reversion method you applied once that horizon ends
Public company filings offer a useful reference point. SEC filing disclosures commonly show allowance roll-forwards that break out beginning balance, provisions, write-offs, and recoveries, a format worth mirroring even if you’re not a public filer, since auditors and lenders will expect similar transparency.
Operational Best Practices and Automation
Aging analysis only creates value if it happens on a schedule and triggers action, not just observation.
A workable cadence looks like this: collections staff review the aging report weekly, focused on anything past 30 days. Finance leadership reviews it monthly at the aggregate level, watching bucket trends and allowance adequacy. Credit policy gets revisited quarterly or whenever a customer’s payment behavior changes materially.
Automation makes that cadence sustainable instead of aspirational, and manual AR processes carry real costs that grow with your customer base:
- Set dunning emails to fire automatically at 1, 30, and 60 days past due, rather than relying on someone remembering to send them.
- Build dashboard alerts that flag any account crossing into the 61-plus bucket for the first time.
- Route accounts that hit 90-plus days into a collections task queue automatically, rather than waiting for a manual review to catch them.
QuickBooks’ guidance points to this kind of threshold-based automation as one of the more reliable ways to keep follow-up consistent. Tie your aging system to your CRM so collections notes, dispute records, and payment promises live next to the customer record, not in a separate spreadsheet someone forgets to update.
Pro Tip: Log every promise-to-pay date a customer gives you directly in the aging notes. A pattern of broken promises is one of the clearest early signals that an account needs to move from internal collections to outside help.
When Aging Data Points to Legal Escalation
Certain patterns in an aging report signal it’s time to stop calling and start preparing a legal case: invoices past 90 days with no payment plan, a communication log that’s gone silent, or repeated broken promises with no dispute filed. Acting on these signals early, as covered in our guide on tackling aging receivables before they become write-offs, keeps recovery odds on your side.
Before engaging outside counsel, organize your aging detail, original invoices, signed contracts or terms, and a chronological communication log. Well-documented accounts with complete communication trails get accepted by attorneys faster and move to action sooner, since the attorney isn’t starting from scratch to establish the debt’s validity.
How AR Aging Shapes Cash Flow Management
An aging report is a forward-looking cash tool, not just a collections list. The dollars sitting in your 31 to 60 and 61 to 90 buckets represent cash you’ve already earned on paper but can’t yet spend, and that gap is exactly what causes otherwise profitable companies to miss payroll or delay vendor payments.
When you build a rolling cash forecast, aging data lets you weight expected collections realistically instead of assuming every invoice converts to cash on schedule. If your historical pattern shows that only 60% of invoices in the 61 to 90 bucket ever get collected in full, your forecast should reflect that, not the optimistic assumption that all of it arrives next week.
Aging also exposes the difference between a revenue problem and a collections problem. A company can have strong sales and still run into a cash crunch if its aging buckets are creeping older every month. Conversely, flat sales with a tight, current-heavy aging profile can still produce healthy, predictable cash flow.
Tie your aging review to your cash forecasting cycle directly. If you update your 13-week cash forecast weekly, pull fresh aging data on the same day. Stale aging data feeding a cash forecast is one of the more common ways finance teams get blindsided by a shortfall they should have seen coming three weeks earlier.
Common Mistakes When Preparing and Reading Aging Reports
The most frequent error is bucketing by invoice date instead of due date. Two invoices issued on the same day but carrying different payment terms, net-30 versus net-60, will be at completely different points in their collection lifecycle even though they look identical by invoice date alone.
A second common mistake: ignoring unapplied cash and credit memos when calculating bucket totals. This inflates past-due balances and can trigger collections calls to customers who’ve already paid, which damages the relationship for no reason.
Third, treating the aging report as a static document rather than a living one. Reports pulled inconsistently, sometimes weekly, sometimes monthly, with the “as of” date shifting, make trend analysis unreliable. Pick a cadence and a fixed reference point and stick to it.
Fourth, failing to segment by credit terms before drawing conclusions. Lumping a net-30 customer and a net-90 customer into the same aging bucket comparison misrepresents which relationships are actually underperforming.
Finally, many teams stop at the aging report and never connect it to the allowance calculation or the cash forecast. The fix is procedural: build the allowance update and the cash forecast refresh into the same workflow that produces the aging report, so one naturally feeds the next.
Industry Variations in Aging Analysis and Benchmarks
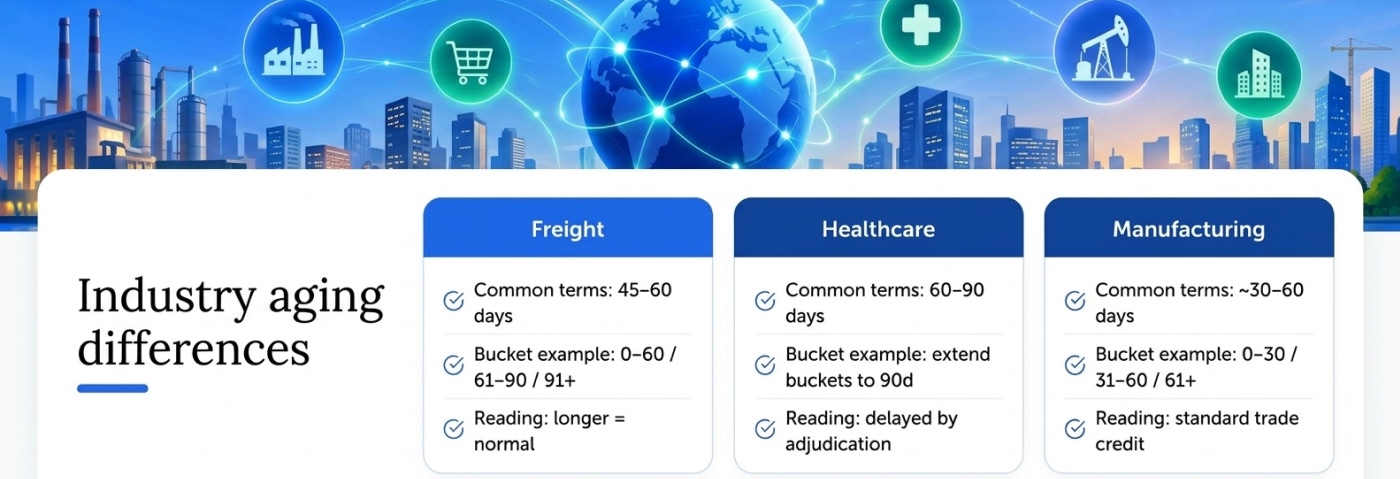
Standard 30-day buckets make sense for a retailer selling on net-30 terms. They make far less sense for a freight broker extending net-60 terms industry-wide, or a construction subcontractor working on payment schedules tied to project milestones rather than calendar days.
Freight and logistics companies often see naturally longer aging profiles because shippers and brokers frequently negotiate 45 to 60-day terms as standard practice, not as a sign of distress. An aging report built on standard 30-day buckets will make an entire freight portfolio look chronically late when it’s actually performing to plan. Businesses in that sector generally shift their bucket boundaries to 0 to 60, 61 to 90, and 91-plus to get a realistic read.
Healthcare and B2B service providers billing insurance or large enterprise customers face a different distortion: payment cycles tied to third-party adjudication or enterprise accounts-payable batching can stretch 60 to 90 days as a matter of routine, independent of customer creditworthiness. Manufacturing and wholesale distribution, by contrast, tend to track closer to standard 30 and 60-day buckets, since B2B trade credit in those sectors is more standardized.
There’s no single universal benchmark for “good” aging performance across industries, because the right benchmark depends on your actual credit terms. The more useful exercise is comparing your own aging profile against your own stated terms: if you offer net-30 and 70% of your balance sits current or under 30 days, that’s a healthy profile. If you offer net-30 and half your balance sits past 60 days, the report is telling you something your credit policy needs to address.
How Credit Policies and Terms Shape Your Aging Profile
Your aging report is, in large part, a mirror of the credit terms you set. A company that extends net-60 terms to every customer regardless of creditworthiness will naturally show an aging profile skewed older than a company that runs tight net-15 terms with credit checks on every new account.
Loosening terms to win a deal, such as extending net-45 instead of net-30 for a key account, will shift that customer’s invoices into what looks like a “late” bucket under your standard aging template, even though the customer is paying exactly on time under their negotiated terms. This is why segmenting aging data by actual contractual terms, not just calendar days, matters for accurate interpretation.
Credit policy also determines how much risk concentrates in your older buckets before you even send the first invoice. A business that runs credit checks, sets defined credit limits, and requires deposits for new or high-risk customers will generally see fewer surprises in the 90-plus bucket than one that extends open terms to any customer who asks. Reviewing aging data by customer segment (new versus established, small versus enterprise, service versus product) often reveals that a handful of loosely vetted accounts are driving a disproportionate share of your oldest receivables.
Tightening terms for repeat late payers, requiring deposits on new accounts above a certain size, or moving persistently slow-paying customers to cash-on-delivery are all policy levers that show up as measurable improvement in your aging profile within one to two billing cycles.
Using Aging Analysis for Forecasting and Budgeting
Aging data earns its keep in the budgeting process by grounding revenue assumptions in collection reality rather than invoiced totals. A sales forecast that assumes 100% of invoiced revenue converts to cash on the stated due date will consistently overstate near-term liquidity, especially for companies with a meaningful share of receivables sitting in the 60-plus bucket.
Build your collections forecast off actual historical conversion rates by bucket. If your data shows that invoices entering the 31 to 60 bucket historically collect at 85% within the following 30 days, while invoices entering the 91-plus bucket collect at only 40%, apply those rates to your current aging balances to project realistic near-term cash inflows.
This same data feeds annual budgeting. If your aging trends show a structural shift, with average days-to-collect rising two or three months in a row, that’s a signal to budget for tighter working capital or to plan a credit policy change before the next fiscal year starts, rather than discovering the cash gap mid-year. For a broader view of how this fits into your receivables function, see our guide to accounts receivable management and debt recovery strategies.
When It’s Time to Bring in Retrievables
Internal collections work for accounts still communicating and negotiating. Once an account goes silent past 90 days or breaks a second payment promise, the math usually favors outside help over continued internal chasing.
Retrievables connects businesses with a nationwide network of collection attorneys and agencies who review and accept cases based on fit, rather than assigning whatever attorney happens to be available. There’s no upfront cost to businesses; attorneys and agencies are paid a percentage of what they actually recover, which keeps their incentives aligned with getting your money back rather than billing hours.
Getting a case ready is straightforward: upload your organized aging detail, the original invoices, any signed contracts, and your communication log. The more complete that file, the faster an attorney can evaluate it and start work. Explore debt collection services built specifically around matching your case to the right attorney or agency, no matter your industry or the size of the balance.
Conclusion
The conventional advice on aging analysis stops at “run the report and call the late accounts.” That’s incomplete. Treated properly, and as ASC Topic 326 effectively demands, the aging report is the single source that feeds three decisions: who gets called this week, how much you reserve for bad debt this quarter, and how you forecast cash for the next twelve months.
Prioritize documentation over sophistication. A simple percent-of-bucket allowance with clear notes on why you chose your rates will hold up to audit scrutiny better than a complex model nobody can explain a year later. The same logic applies to escalation: a clean aging report with a complete communication log lets a collections attorney move fast, whatever the dollar amount involved.
FAQ
How do you analyze an accounts receivable aging report?
Sort accounts by dollar amount within each bucket, starting with the oldest and largest balances, then check for red flags like concentration in one customer or rising older-bucket totals month over month. Cross-reference against payment promises and dispute notes before deciding whether to negotiate, offer a payment plan, or escalate.
What is a good AR aging percentage?
There’s no universal benchmark, since the right number depends on your credit terms. A healthy profile generally shows most of your balance current or under 30 days past due relative to your stated terms; if you offer net-30 and a large share of your balance sits past 60 days, that signals a credit policy or collections gap.
What method is used to analyze accounts receivable aging?
The standard method sorts open invoices into time bands based on days past the due date, commonly 0 to 30, 31 to 60, 61 to 90, and 91-plus, then totals exposure by bucket and by customer. This is often paired with turnover and DSO calculations for a fuller efficiency picture.
How do you create an accounts receivable aging report?
Export all open invoices with due dates and balances, calculate days past due for each one, and assign each invoice to a bucket using a lookup formula or your accounting system’s built-in report. Reconcile the total back to your general ledger AR balance before acting on the results.
What does Retrievables charge for help with overdue accounts?
Collections through Retrievables run on a contingency model: attorneys and agencies are paid a percentage of what they recover, with no upfront cost to the business. Current details are available directly on the Retrievables site.